Product
Inside the SphereTI platform
SphereTI runs as one console. Five intelligence modules feed a single dashboard: credentials surfacing in dark-web markets and infostealer logs, domains registered to be mistaken for yours, vulnerabilities under active exploitation, and cyber decoys that fire when something touches an asset nothing legitimate should. The screenshots below are from the product. The walkthrough runs the same modules against your own domain.
Five screens, in the order you would meet them. Each capture is the real interface, cut off where the window was — the counters, columns and filters below are described exactly as they appear.
The dashboard
Data intelligenceThe opening screen answers one question: what changed. Attacks detected across sensors, newly observed CVEs, infected systems from infostealer detections, leaked credential pairs, and the domains under active monitoring — each carrying its own trend line for the selected window, which switches between week, month and year.
Underneath, CVEs broken out by vendor and stacked critical through low, so a single row shows both how much a vendor is contributing and how much of it is worth this week. The map beside it counts attack volume by country, with the ranked table next to it for the numbers the shading only implies.
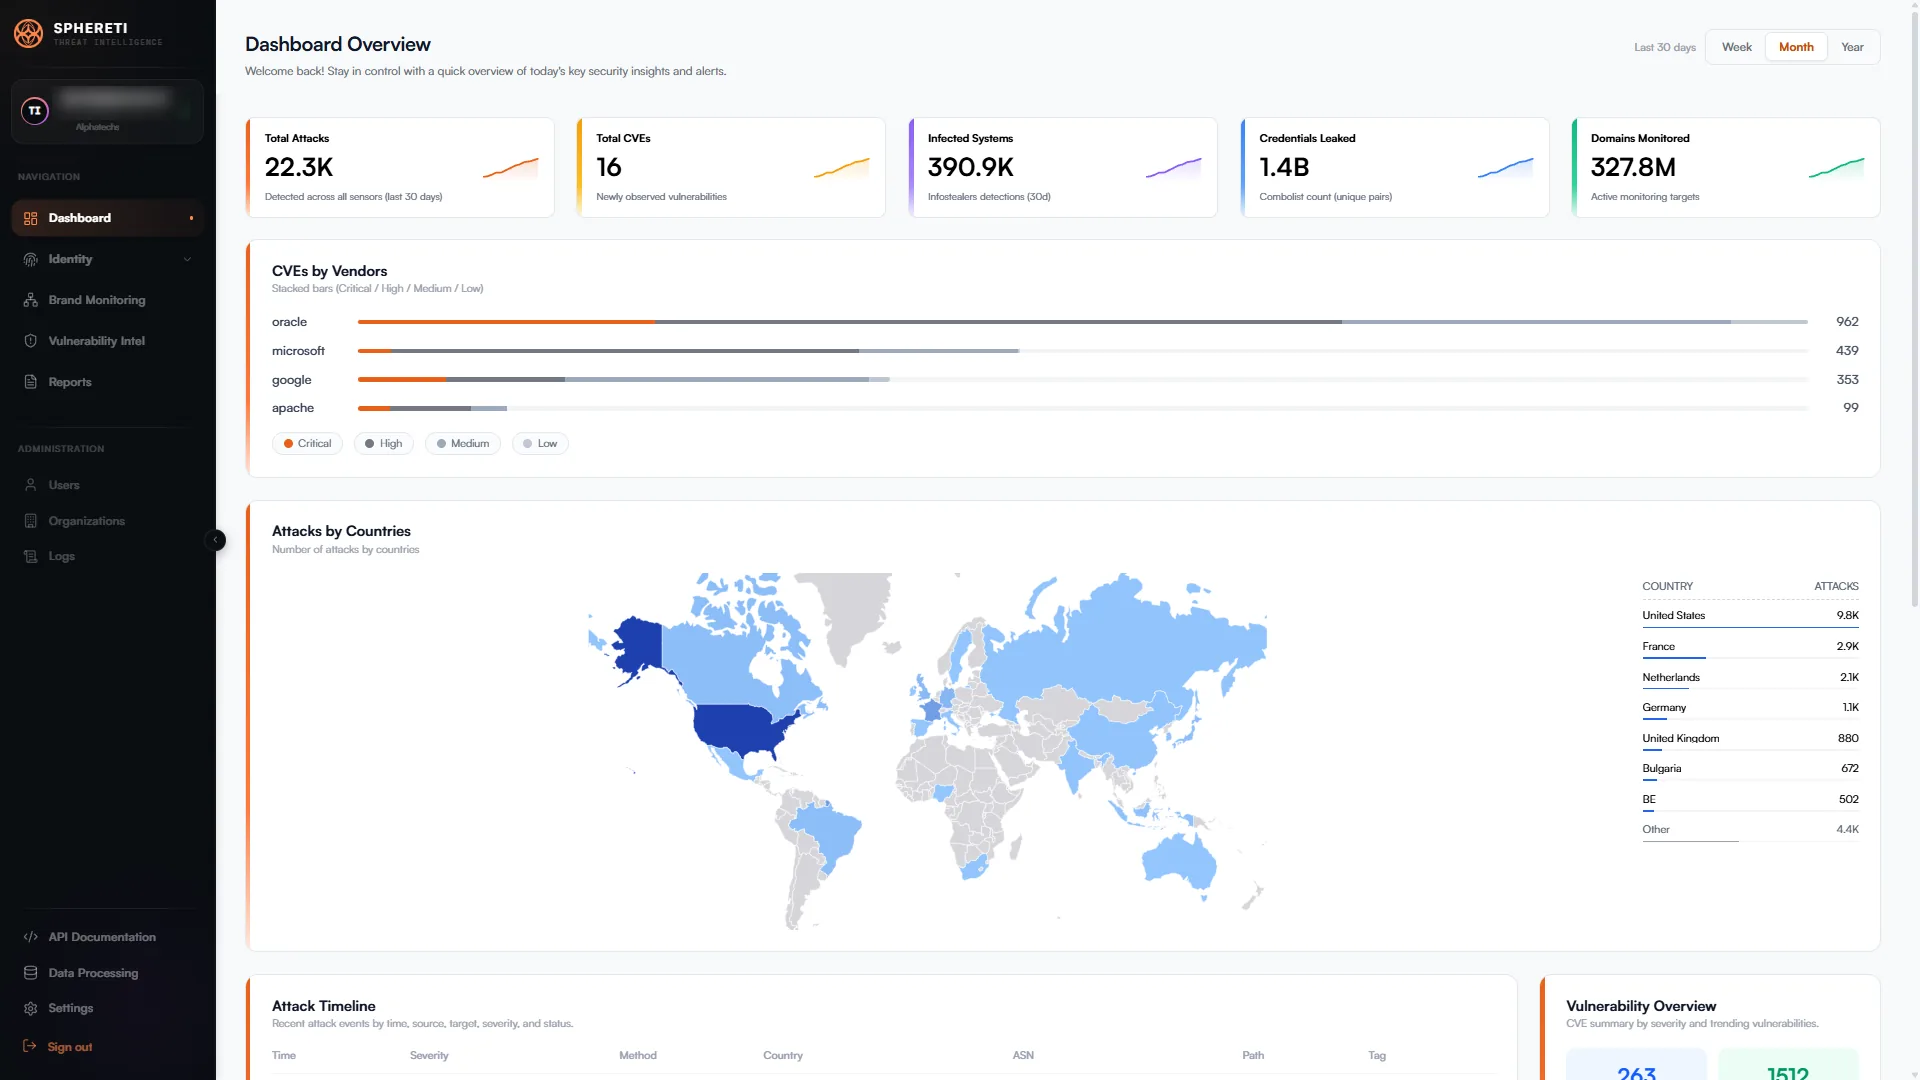
Dashboard Overview. Counters, CVEs by vendor, and attacks by country. Figures are whatever the console held when the capture was taken. Timeline and threat analysis
CorrelationFurther down the same screen, the individual events: time, severity, HTTP method, source country, ASN, the path that was requested and the tag that classifies it — reconnaissance, noise, and the ones that are neither. Beside it, vulnerabilities bucketed by severity with the CVEs currently trending.
The treemaps at the bottom are proportional, so area is volume: malware families on the left, and on the right the antivirus products that were installed on the machines those families compromised anyway. That second chart is the shape of a finding the team has published in full — across a 60-day window, the source recorded 786,041 antivirus installations across 881,387 compromised systems.
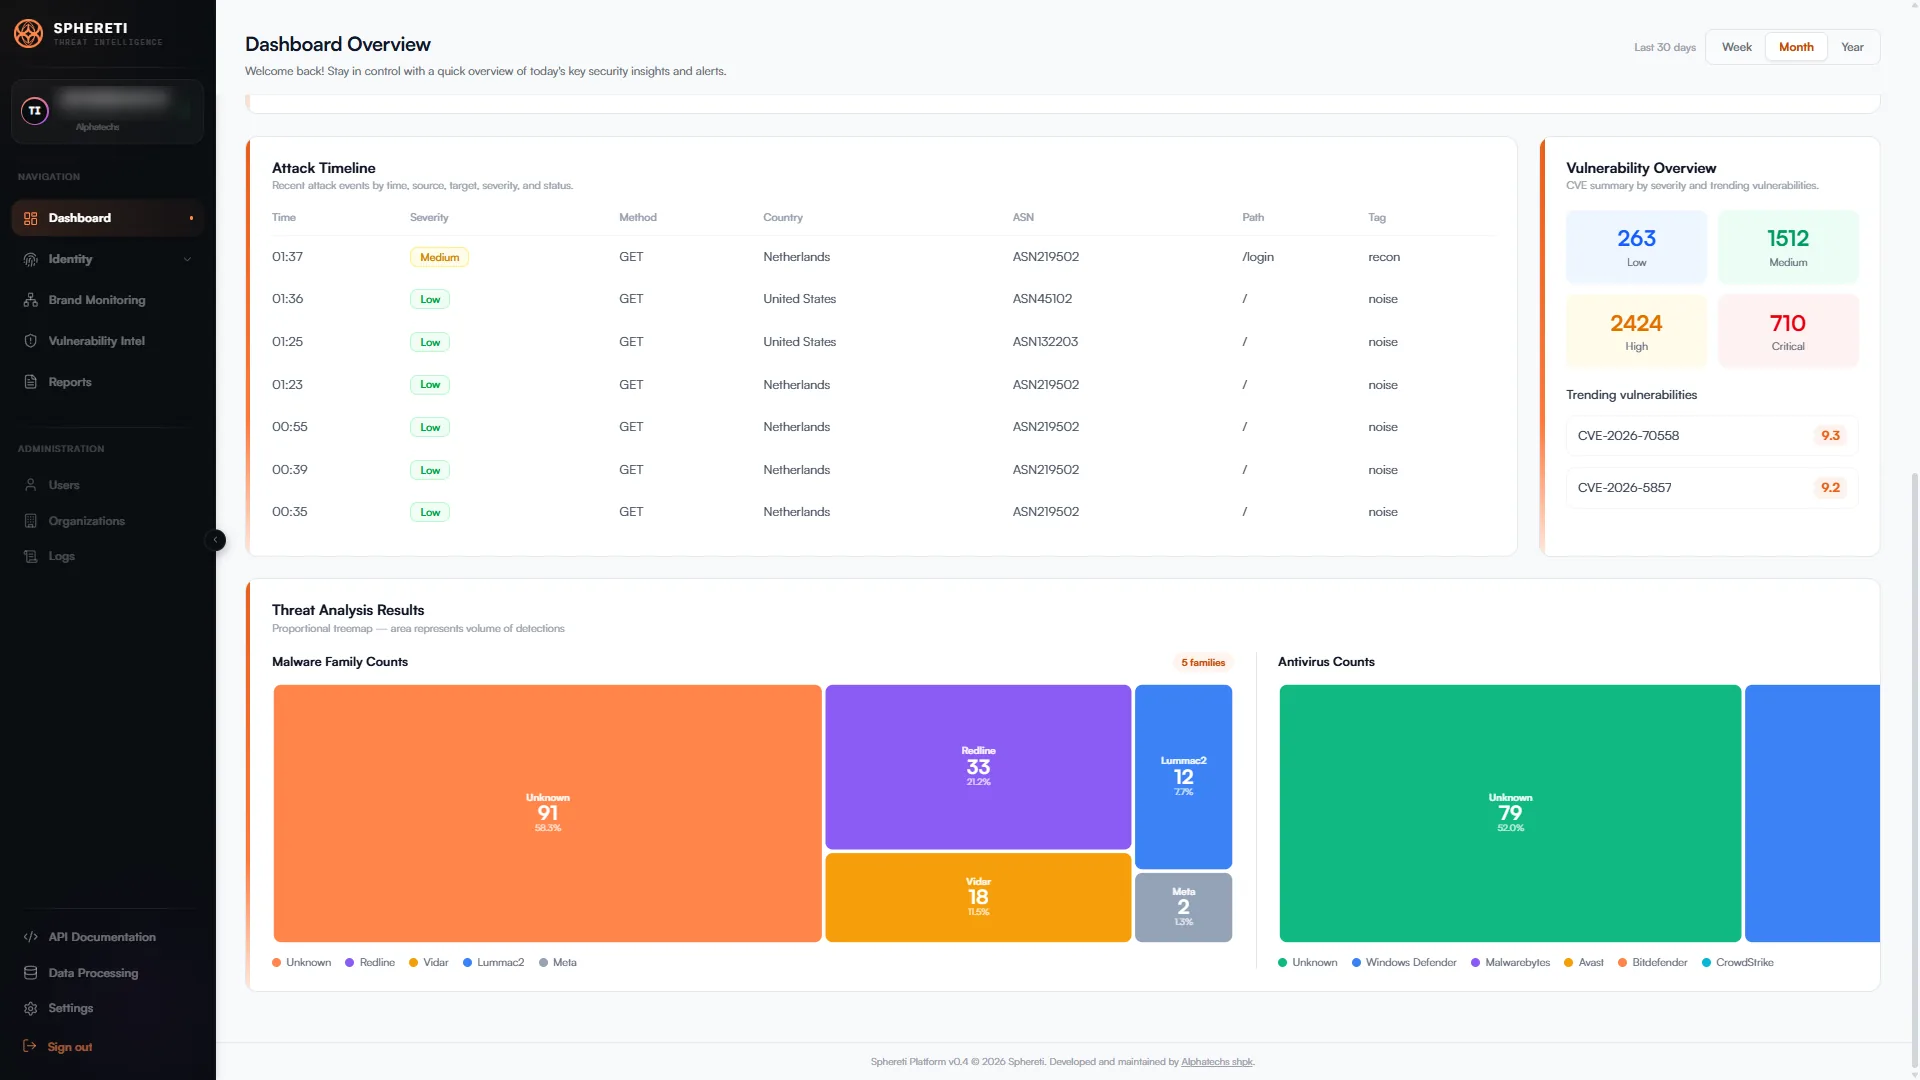
Attack timeline, vulnerability overview, threat analysis. Malware family and antivirus counts as proportional treemaps. Credential exposure
Dark web & stealer logsSearch exposed credentials three ways: by website domain, by email domain, or by IP and subnet. Wildcard matching widens a query past the exact string, and the date filter bounds it to a window. Combolists and banking data sit alongside it under the same Identity module.
A result names the account, which is the only form of this finding anyone can act on — reset that password, revoke those sessions. Stealer log monitoring is where most of the supply comes from: credentials taken off an employee's own infected device, where nothing at the company was breached and no breach check will ever show it.

Credentials. The search, without its results — rows are the part that only means something against a domain you own, so the walkthrough runs it against yours. Lookalike domains
DNS & brand monitoringGive it a domain and it analyzes DNS records for names built to be mistaken for yours, or TLS certificates for the same thing one layer up. Minimum similarity score and maximum edit distance are both tunable, which is the difference between a list you read and a list you archive unread.
Findings come back ranked and counted by severity: risk level, attack type — TLD hijacking, in the capture — similarity, threat score, the date it was first detected, and a recommendation. Expanding a row shows the reasoning behind it: domain base, targeted brand, confidence score, TLD risk, and the record type proving the thing resolves. This is the module that found multiple domains impersonating Albania's e-Visa portal where the government advisory had named one.
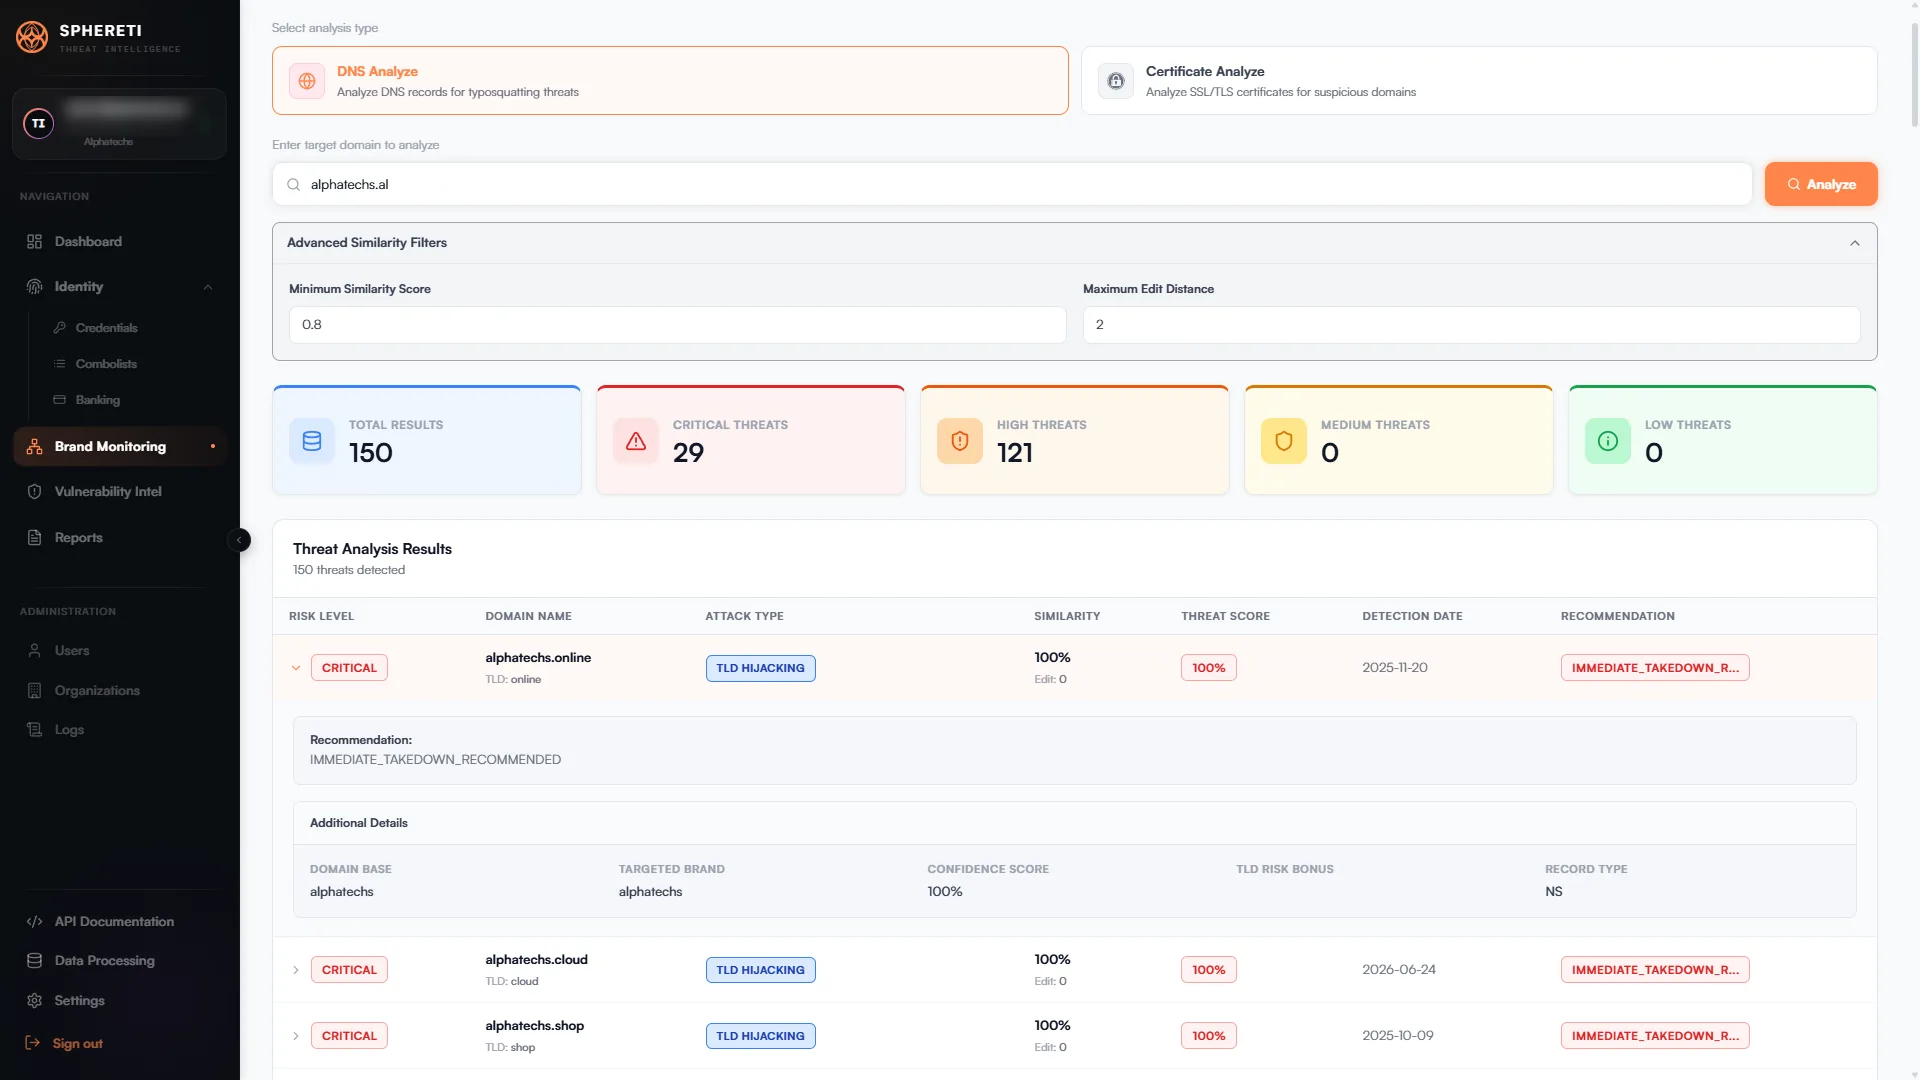
Brand Monitoring — DNS Analyze. Similarity filters, severity counters, and ranked results with an expanded recommendation. Vulnerability intelligence
PrioritySearch active exploitation attempts by IP address, by CVE, or by technology tag. The capture searches a tag — the software itself — and returns the attempts recorded against it in the window, the tags that cluster with it, and a frequency timeline that shows whether the pressure is building or has already passed.
The related tags are the useful part: specific CVEs, attack categories like credential stuffing and file inclusion, and the individual plugin names being probed. Below the timeline, the addresses doing it and the CVEs they are exploiting. It answers the ranking question rather than the inventory one — not which vulnerabilities exist, but which are being used this week against what you run.
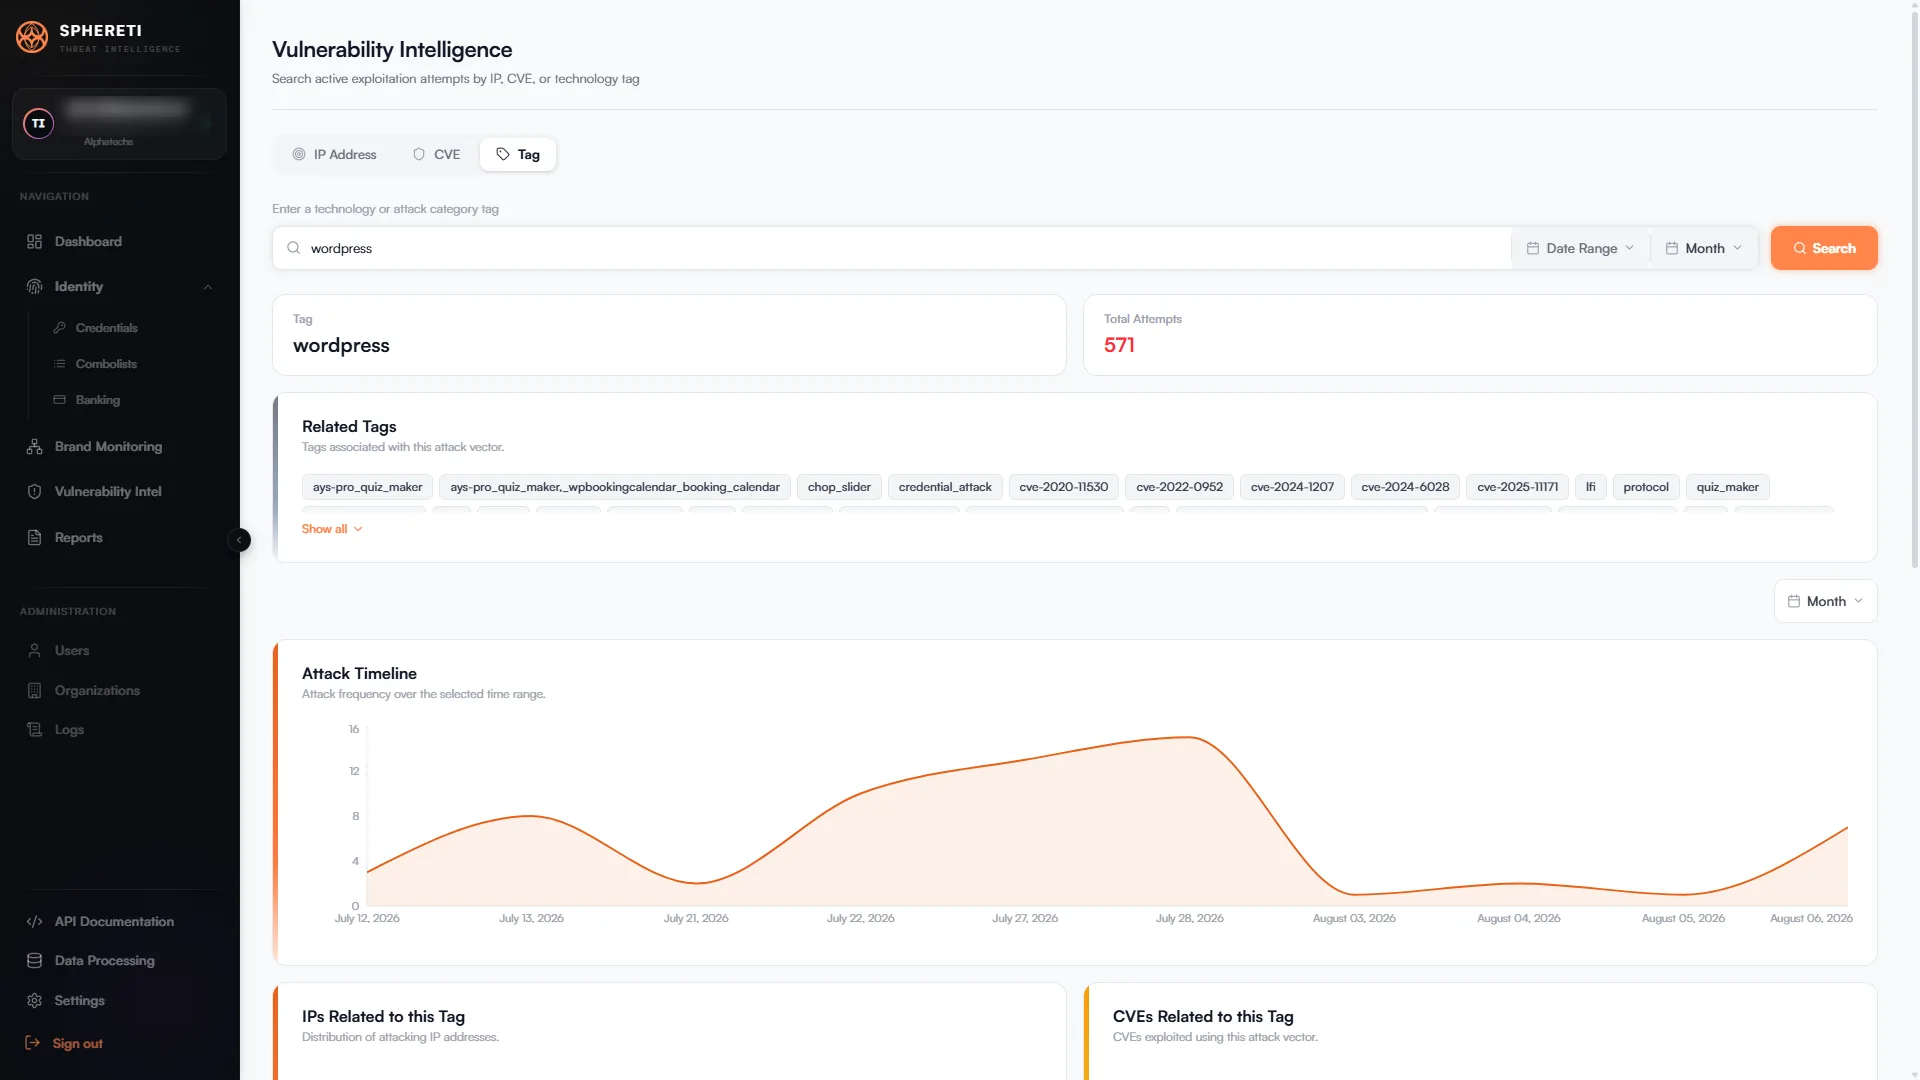
Vulnerability Intel. Search by IP, CVE or technology tag, with related tags and an attack-frequency timeline.
What the screenshots stop short of
Four things do not survive being turned into a screenshot, and they are the four a walkthrough exists for.
- Your domain, not this oneEvery module above, run against your own estate — which is the only version of these screens that tells you anything.
- Cyber decoysThe one module not pictured here. Where the fake credentials and hosts get planted, and what the alert looks like when something touches one.
- What reaches youReporting, the API, and how a finding gets from the console to the person who has to act on it.
- Scope and pricingDomains, users and modules, against what you actually need covered. Compare the published plans.
Request a free demo
Contact our team with your domain and we will run the modules against it, then take you through what came back. No obligation, and we will say so plainly if there is nothing there worth paying for.